
Case study · Self-initiated · 2026
The Ray Family Story
Almost five thousand pages of handwritten research turned into a Neo4j graph; and from it, a 326-year family history that can be read, explored, and expanded.
The brief
Jen Ray knew she came from an old family, but the families’ notes were fragmented and hard to understand. By developing an AI-assisted research pipeline, we created a robust narrative history of the family, with exploratory visualizations to explore the past and add to it as we learn more. The result is a living history, a family network, descendant trees, lifespans, maps, a media archive and a register of this community of Rays all generated from one graph.
- Client
- Self-initiated
- Year
- 2026
- Role
- Research pipeline, graph database, data visualization, Data Narrative, Website development
- Live site
- rayfamilystory.com
01 · The source
It started as handwritten notes.
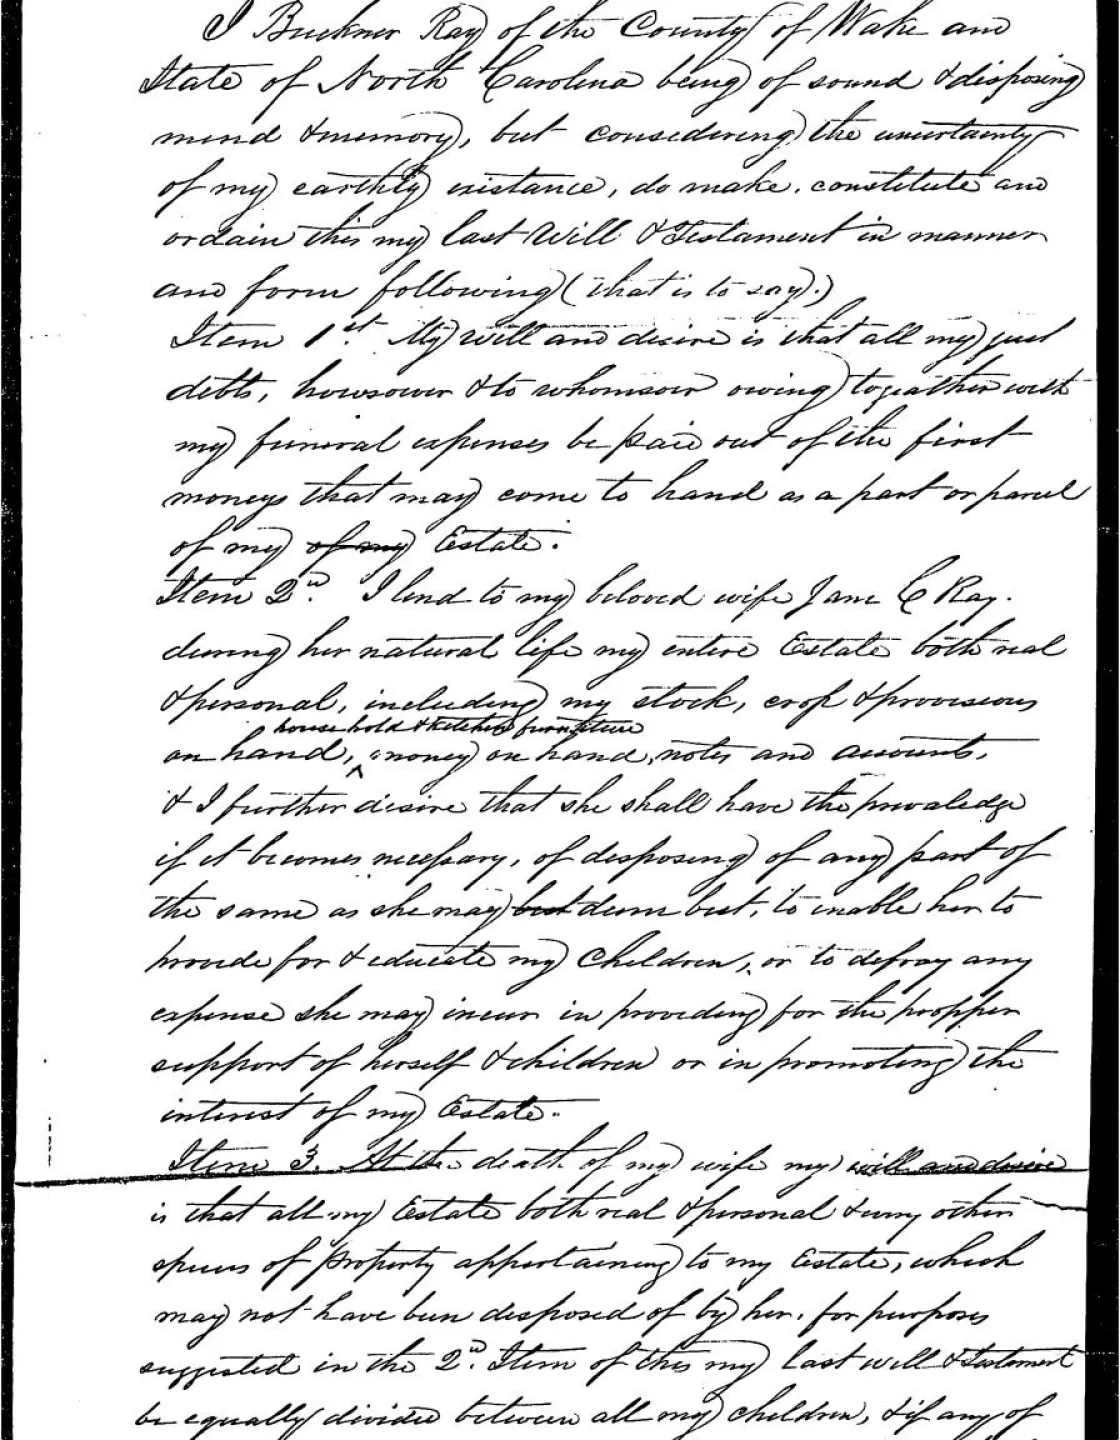
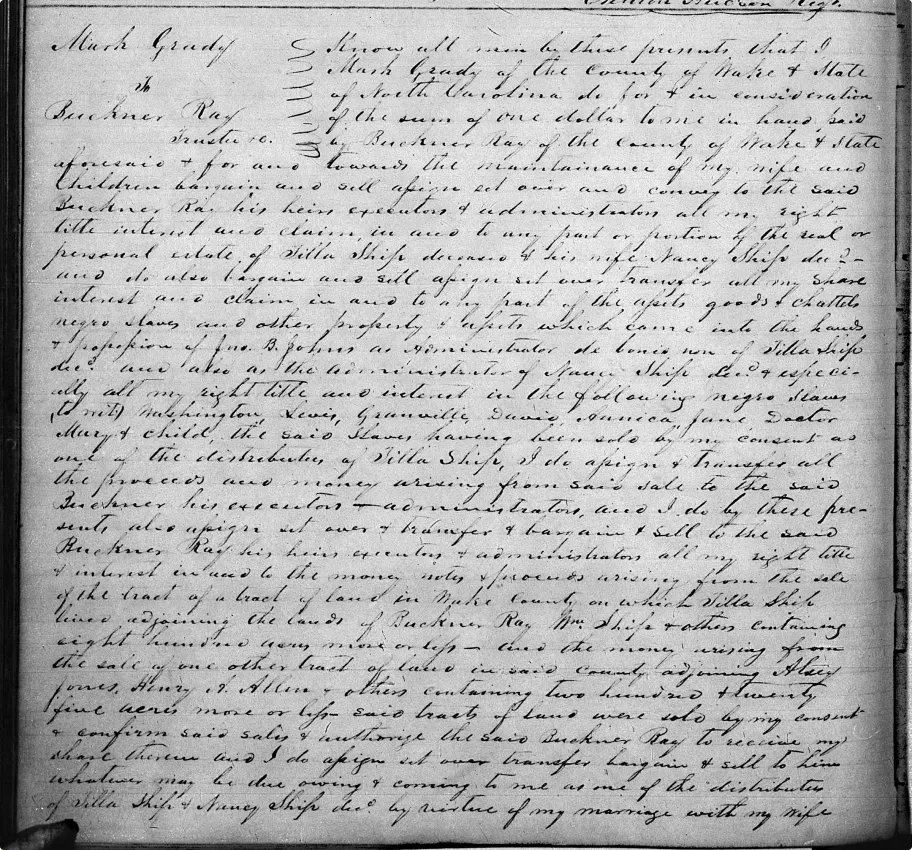
Robert Phillip Upchurch, a retired scientist and academic, began researching his family’s history in Wake County, NC and gave it the last 40 years of his life. Driving the NC back roads to stand at each grave, transcribing deeds verbatim, and reducing all of it to filing systems of forensic care called “biofiles”, Upchurch created detailed documentation of almost 300 families in the region, and the Rays were one of them.
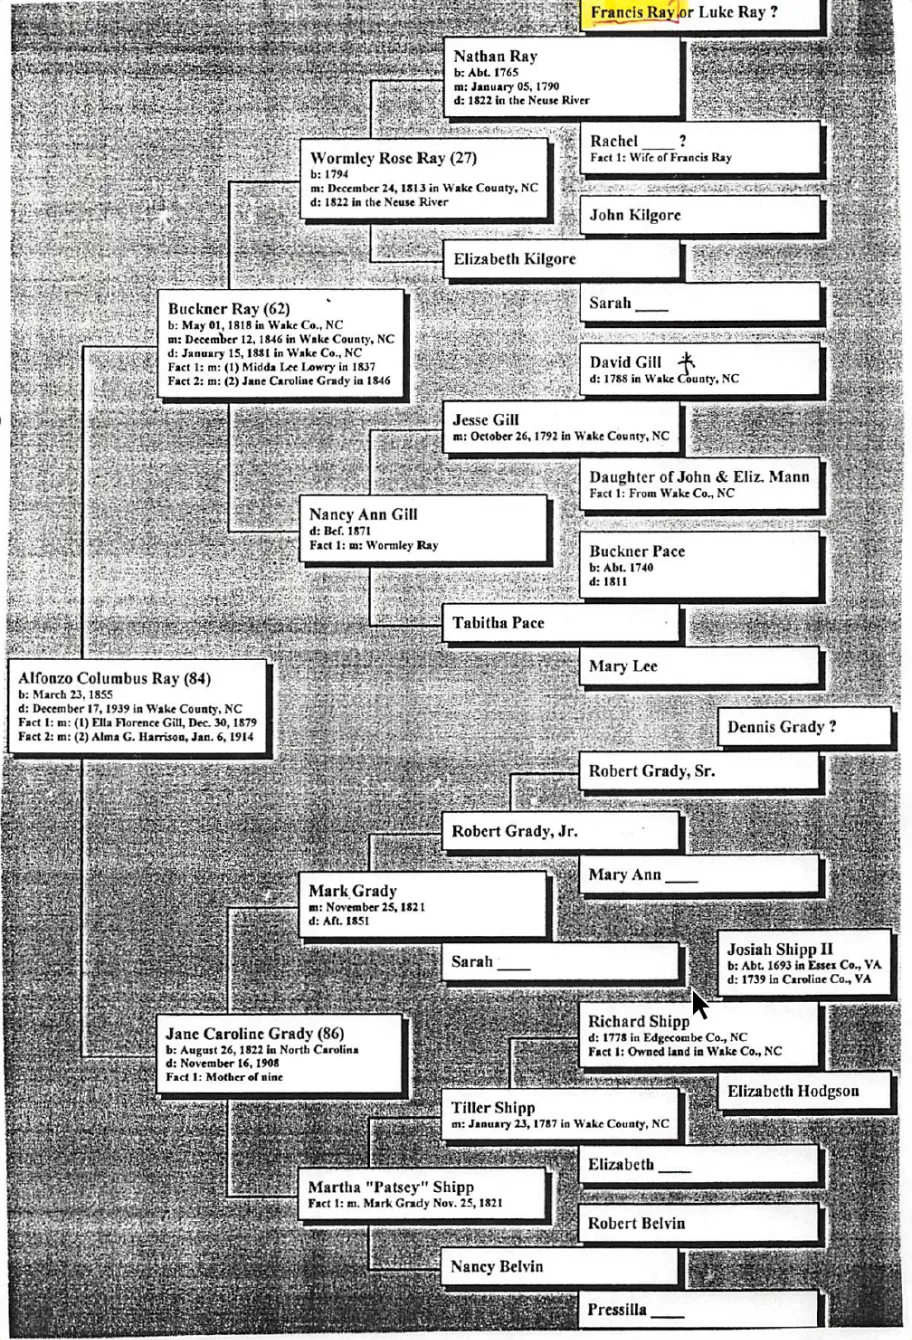
What he left are thousands of pages of research, hand-written analysis, newspaper clippings, real estate sketches, interviews, and legal certificates. Hidden in the patchwork maze of unordered documents is the story of a deeply rural American family. For example, Nathan Ray could not write his name, but his son, Wormley Ray, could. On New Year’s Day, 1822, they both drowned together in a nearby river. Wormley’s three-year-old son, Buckner Ray, went on to have 12 children, and from them, today there are 189 Rays that can trace a direct line to him.
The Ray Family story now spans 10 generations and contains details of 905 people. Among them are records of 28 enslaved people held across 4 generations. There are over 1,000 images covering everything from war heroes, entrepreneurs, funerals, babies, and more.
02 · The method
Every word is data and can be traced back to original sources.
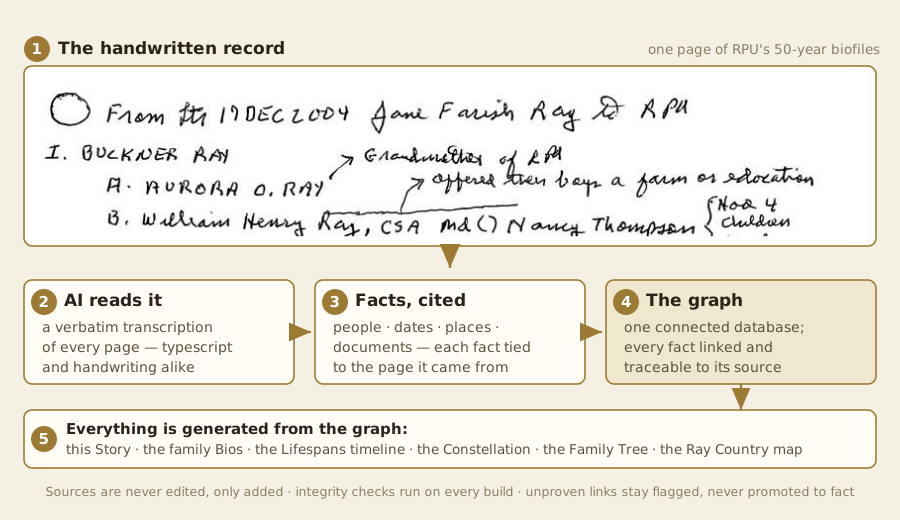
We built an AI-assisted pipeline with a series of harnesses to test, verify, and append each piece of data across the graph, to build the website, charts, and family narrative using an old-fashioned discipline: sources are immutable — never edited, only added. The database is a build artifact, regenerated from a script, never touched by hand. Ten automated gates verify the whole structure on every build. Unproven links carry an uncertainty flag instead of being promoted to fact.
- 01
Register
Each binder page, deed, will, pension file, obituary and interview is scanned and registered as an immutable source.
- 02
Transcribe
Verbatim transcription — 306,000+ words so far. Quoted phrases in the finished history come straight from these pages.
- 03
Extract
Facts are pulled into the graph’s own fields, each one cited back to the page it came from.
- 04
Verify
Nine gates per build: no broken links, no duplicated people, versions in agreement, certainty flags honoured.
- 05
Generate
Bios, timelines, maps, descendant trees — and the narrative history itself — are all written out of the graph.
- 06
Annotate
Every added source, text edit, and release is recorded in the public research, and annotated to show what we know and what questions remain.
03 · The results
A 326-year story nobody had ever seen.
Individually, the Robert Phillip Upchurch binders held a family. When we combined them, they created a portrait of northern Wake County the family called “Ray Country.” This project compiles the data of this community in ways most genealogical projects never could.
- 4,495
- pages of source documents, across 94 distinct sources
- 306,000
- words transcribed verbatim, none of it paraphrased
- 905
- people in the graph — 478 of them named Ray
- 10
- generations, from about 1700 to a child born in 2009
- 1,456
- nodes: people, places, events, documents, photographs
- 2,209
- relationships — parent-of, spouse-of, enslaved-by, buried-at
- 1,141
- images and scans, each tied to what it depicts
- 28
- enslaved people documented, with a chapter of their own
From the archive
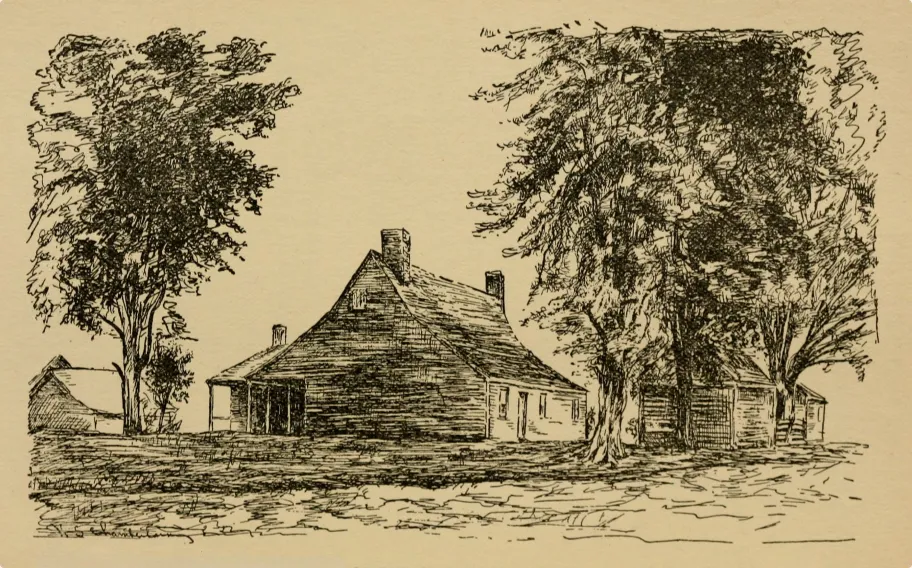
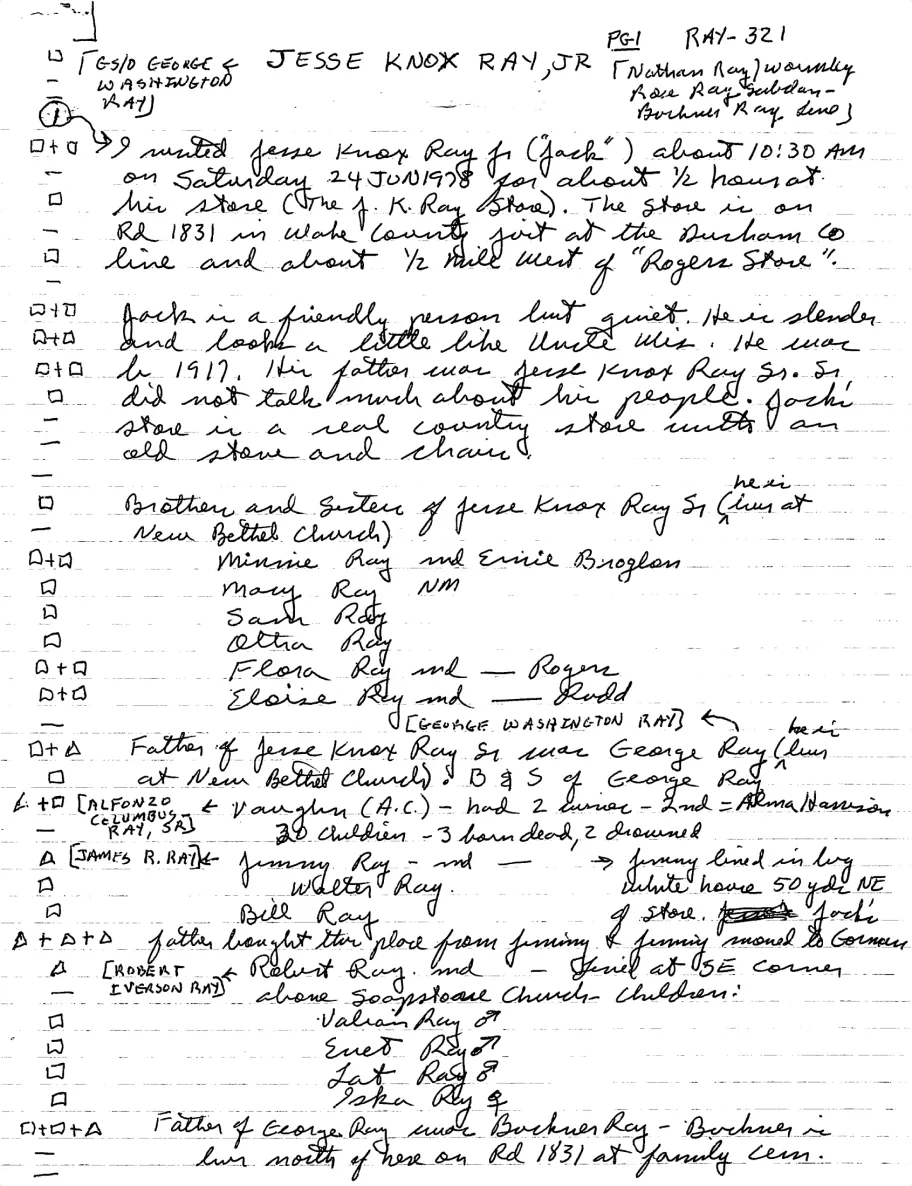
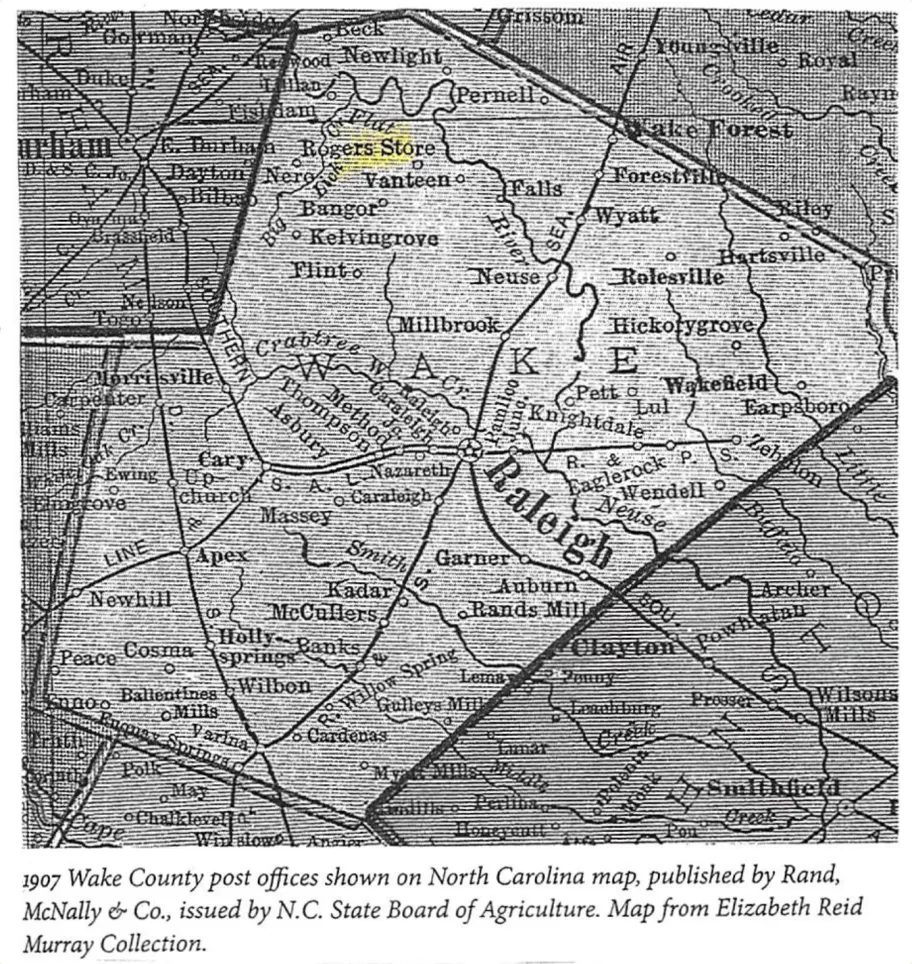
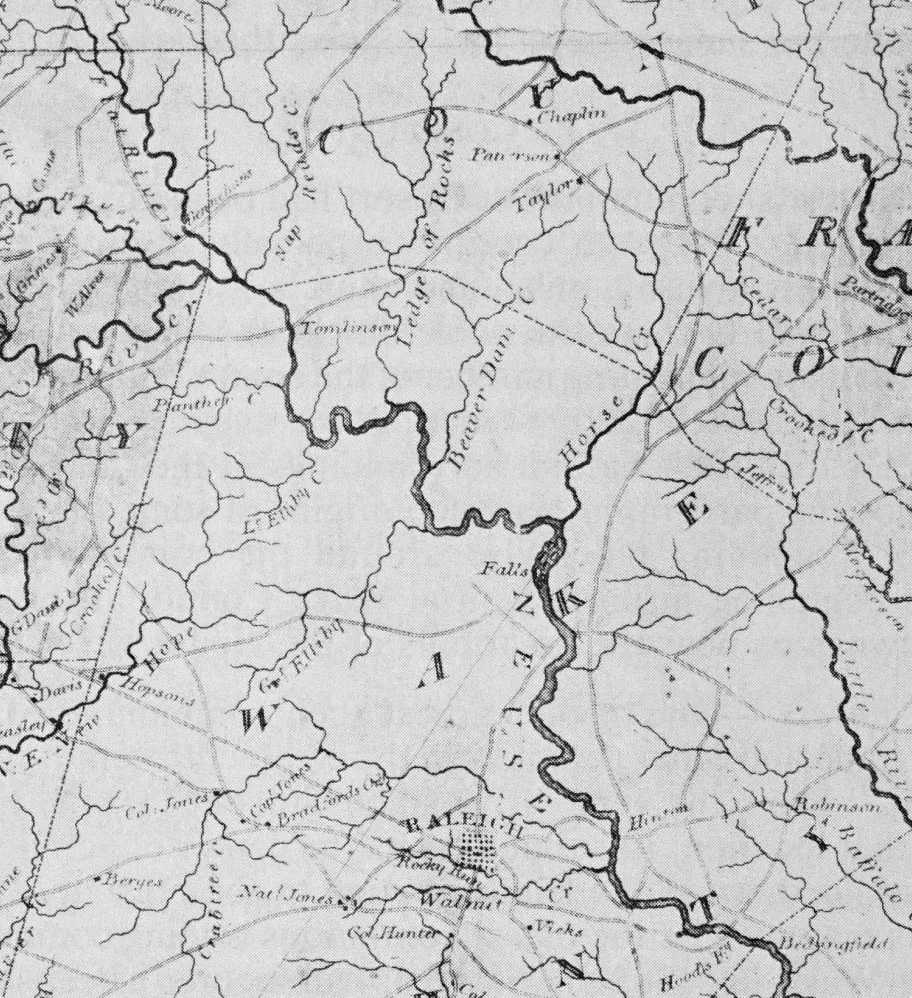
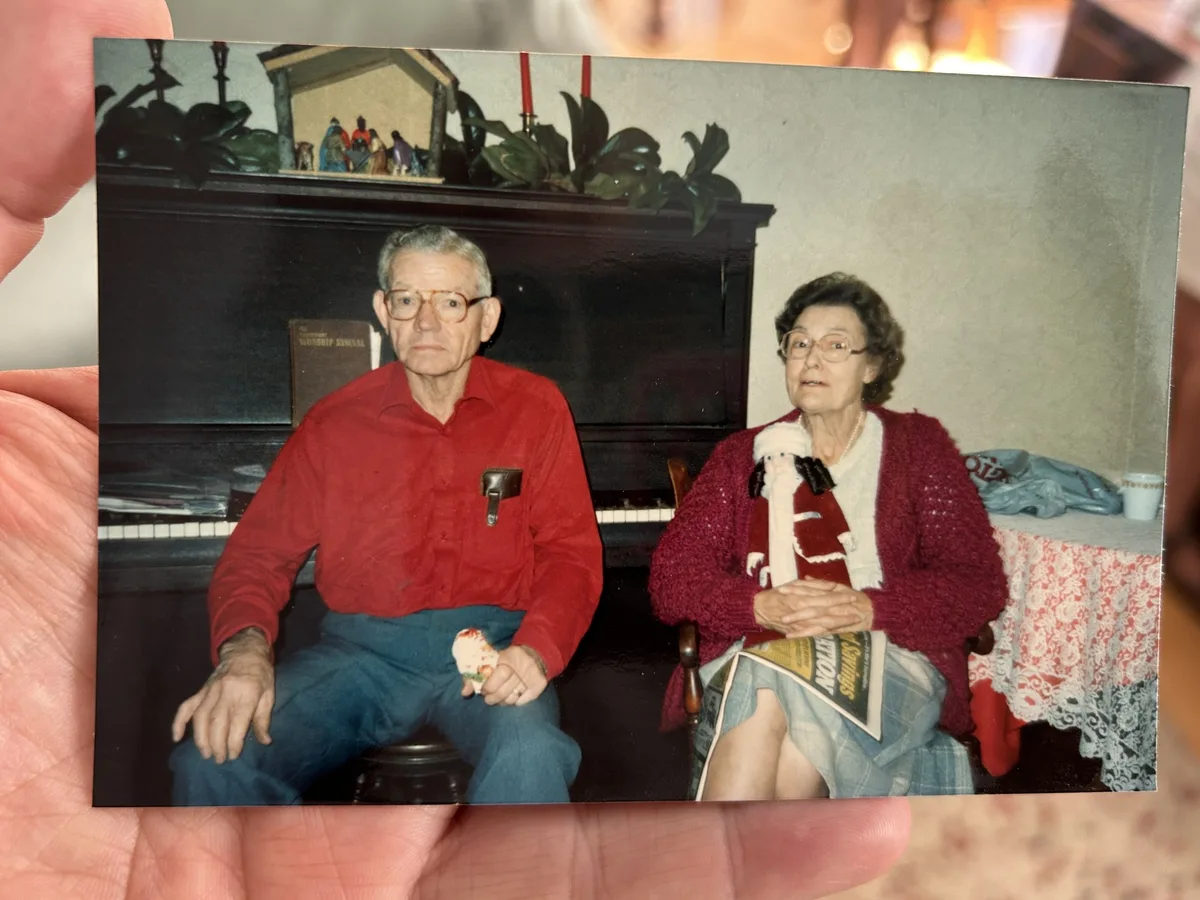
Deeds, maps, binders and photographs — each one tied to the people it represents.
04 · Built to be explored
Nine ways to explore, one source of truth.
Because everything is generated from one graph, no two views can disagree. Filter the network by surname, by region, by whether a link is proven — and the timeline, the maps and the biographies all share the same filter.
- Family Story — A narrative history of the family spanning 10 generations over 326 years — completely generated from the graph database. Reading it means you are reading data.
- Family Network — 802 people as a force graph. Grouped by family surname, or laid out over the whole time period as an innovative connected beeswarm chart.
- Family Tree — Descendant trees drawn as cards and radial layout.
- Lifespans — Every documented life as a bar against three centuries.
- Maps — An overview of Ray Country, a detailed plot of family cemeteries, Land Holdings, and the story of North Carolina counties.
- Places — 75 documented places including a photogrammetric scan of the George Washington Ray House.
- Media — 1,141 scans and photographs, each linked to the people it depicts.
- All People — The full register, searchable, with certainty flags visible.
- Research — Every commit, edit, source, link, and open question.
“So it would be accurate to say that you are currently reading data.”
Every source — each binder page, deed, will, pension file, obituary, and interview — is scanned, transcribed verbatim, and registered as an immutable source: sources are never edited, only added. From those sources, a single build script constructs a property-graph database: at this writing, 1,456 nodes (905 people, plus the places, events, documents, and photographs that connect them) and 2,209 relationships — parent-of, spouse-of, enslaved-by, buried-at, participated-in, depicts. The database is a build artifact: it is never edited by hand, only regenerated from the script, so every fact in the graph traces to a line of code, which traces, through its citation, to an original page.
Automated integrity checks verify the whole structure on every build — no broken links, no duplicated people, versions in agreement — and uncertainty is modeled honestly: unproven links carry explicit certainty flags rather than being silently promoted to fact.
From that one graph, everything else is generated: the family bio pages, the interactive timeline and constellation visualizations, the descendant trees, and — perhaps most novel — this narrative history.
- Made by
- Jen Ray and Jason Forrest, building on Jen’s family recollections and Jason’s work in data visualization and software.
- Standing on
- The research binders of Robert Phillip Upchurch; The Ray Family of Wake Co., NC (William Carroll Ray, 1999); Marl Ellis Ray’s cemetery maps and Ray Country family.
- How it is built
- Immutable source registry → verbatim transcription → property-graph build script → nine verification gates → static generation. Nothing in the database is edited by hand.